概述
官网:https://prometheus.io/
GitHub地址:https://github.com/prometheus/prometheus
Prometheus 是由 Cloud Native Computing Foundation(CNCF) 孵化的开源监控与告警系统,专注于实时数据采集、存储和查询,广泛应用于云原生、容器化(如 Kubernetes)和微服务架构中。它以灵活的数据模型、强大的查询语言和生态扩展性著称,是现代 DevOps 和 SRE(站点可靠性工程)的核心工具之一
二进制安装prometheus
下载解压
[root@prometheus-30 ~]# mkdir /application/data/ -p
[root@prometheus-30 ~]# wget https://github.com/prometheus/prometheus/releases/download/v2.53.3/prometheus-2.53.3.linux-amd64.tar.gz
[root@prometheus-30 ~]# tar -xvf prometheus-3.3.0.linux-386.tar.gz
[root@prometheus-30 ~]# mv prometheus-2.53.3.linux-amd64 /application/prometheus
配置启动服务
[root@prometheus-30 ~]# useradd -M -s /sbin/nologin  prometheus
[root@prometheus-30 ~]# cd /application/
[root@prometheus-30 application]# chown -R prometheus:prometheus prometheus
[root@prometheus-30 ~]# cat /etc/systemd/system/prometheus.service
[Unit]
Description=Prometheus Server
Documentation=https://prometheus.io/docs/introduction/overview
After=network.target

[Service]
Type=simple
User=prometheus
Group=prometheus
Restart=on-failure
ExecStart=/application/prometheus/prometheus   --config.file=/application/prometheus/prometheus.yml   --storage.tsdb.path=/application/prometheus/data   --storage.tsdb.retention.time=15d   --web.enable-lifecycle

[Install]
WantedBy=multi-user.target
启动服务
[root@prometheus-30 ~]# systemctl daemon-reload
[root@prometheus-30 ~]# systemctl enable --now prometheus
[root@prometheus-30 ~]# systemctl status prometheus.service
● prometheus.service - Prometheus Server
   Loaded: loaded (/etc/systemd/system/prometheus.service; enabled; vendor preset: disabled)
   Active: active (running) since Thu 2025-11-20 15:59:18 CST; 1h 40min ago
     Docs: https://prometheus.io/docs/introduction/overview
 Main PID: 1524413 (prometheus)
    Tasks: 14
   Memory: 997.1M
访问Prometheus
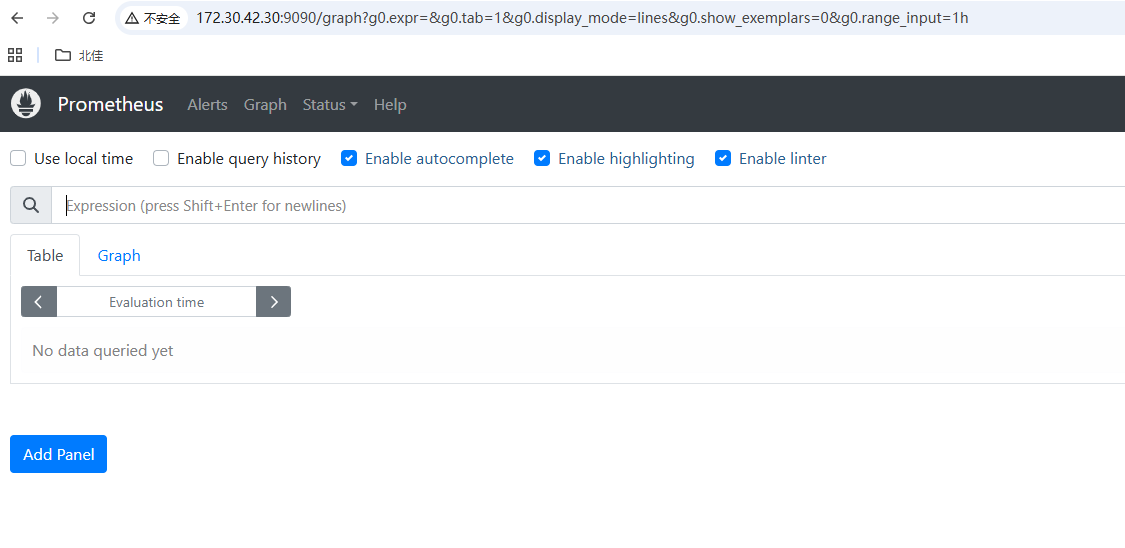
IP:9090端口------http://172.30.42.30:9090/
安装node_exporter监控主机(多台主机就重复以下的步骤进行安装操作)
下载解压
[root@master ~]# mkdir /application/
[root@master ~]# useradd -M -s /sbin/nologin prometheus
[root@master ~]# node_exporter-1.8.2.linux-amd64.tar.gz
[root@master ~]# tar -zxvf node_exporter-1.8.2.linux-amd64.tar.gz
[root@master ~]# cp node_exporter-1.8.2.linux-amd64 /application/node_exporter/
[root@master ~]# cd /application/
[root@master ~]# chown -R prometheus:prometheus node_exporter/
编辑启动文件服务
[root@master ~]# cat /etc/systemd/system/node_exporter.service
[Unit]
Description=node_exporter
Documentation=https://prometheus.io/
After=network.target

[Service]
User=prometheus
Group=prometheus
ExecStart=/application/node_exporter/node_exporter
Restart=on-failure

[Install]
WantedBy=multi-user.target
启动服务
[root@master ~]# systemctl daemon-reload
[root@master ~]# systemctl enable --now node_exporter.service
[root@master ~]# systemctl status node_exporter.service
● node_exporter.service - node_exporter
   Loaded: loaded (/etc/systemd/system/node_exporter.service; enabled; vendor preset: disabled)
   Active: active (running) since Wed 2025-10-22 16:59:56 CST; 4 weeks 1 days ago
     Docs: https://prometheus.io/
 Main PID: 30099 (node_exporter)
    Tasks: 6
   Memory: 19.1M
   CGroup: /system.slice/node_exporter.service
           └─30099 /application/node_exporter/node_exporter
修改prometheus配置文件抓取主机监控
添加job_name
[root@prometheus-30 ~]# cd /application/prometheus
[root@prometheus-30 ~]# vim prometheus.yml #添加以下配置
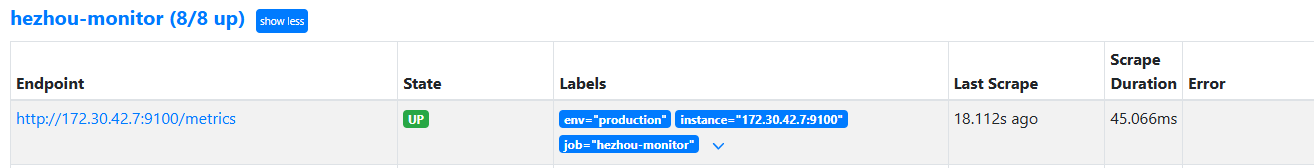
- job_name: "hezhou-monitor"
static_configs:
- targets:
- "172.30.42.7:9100"
labels:
env: production
[root@prometheus-30 ~]# ./promtool check config prometheus.yml #检查配置是否存在错误
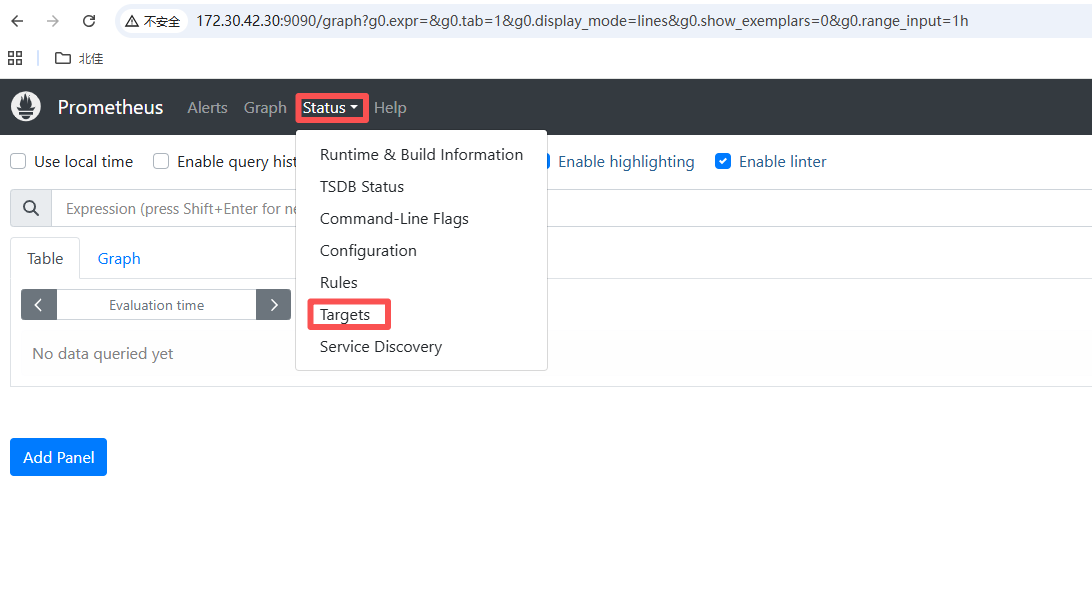
[root@prometheus-30 ~]# systemctl restart prometheus.service #重启服务查看主机是否被监控上